What is a Diagram?
Understanding what a diagram is in Ordit will be helpful in understanding the rest of the documentation as diagrams are at the core of what makes Ordit special!
Diagrams are pages where people can capture, organise, and share work that needs to be completed.
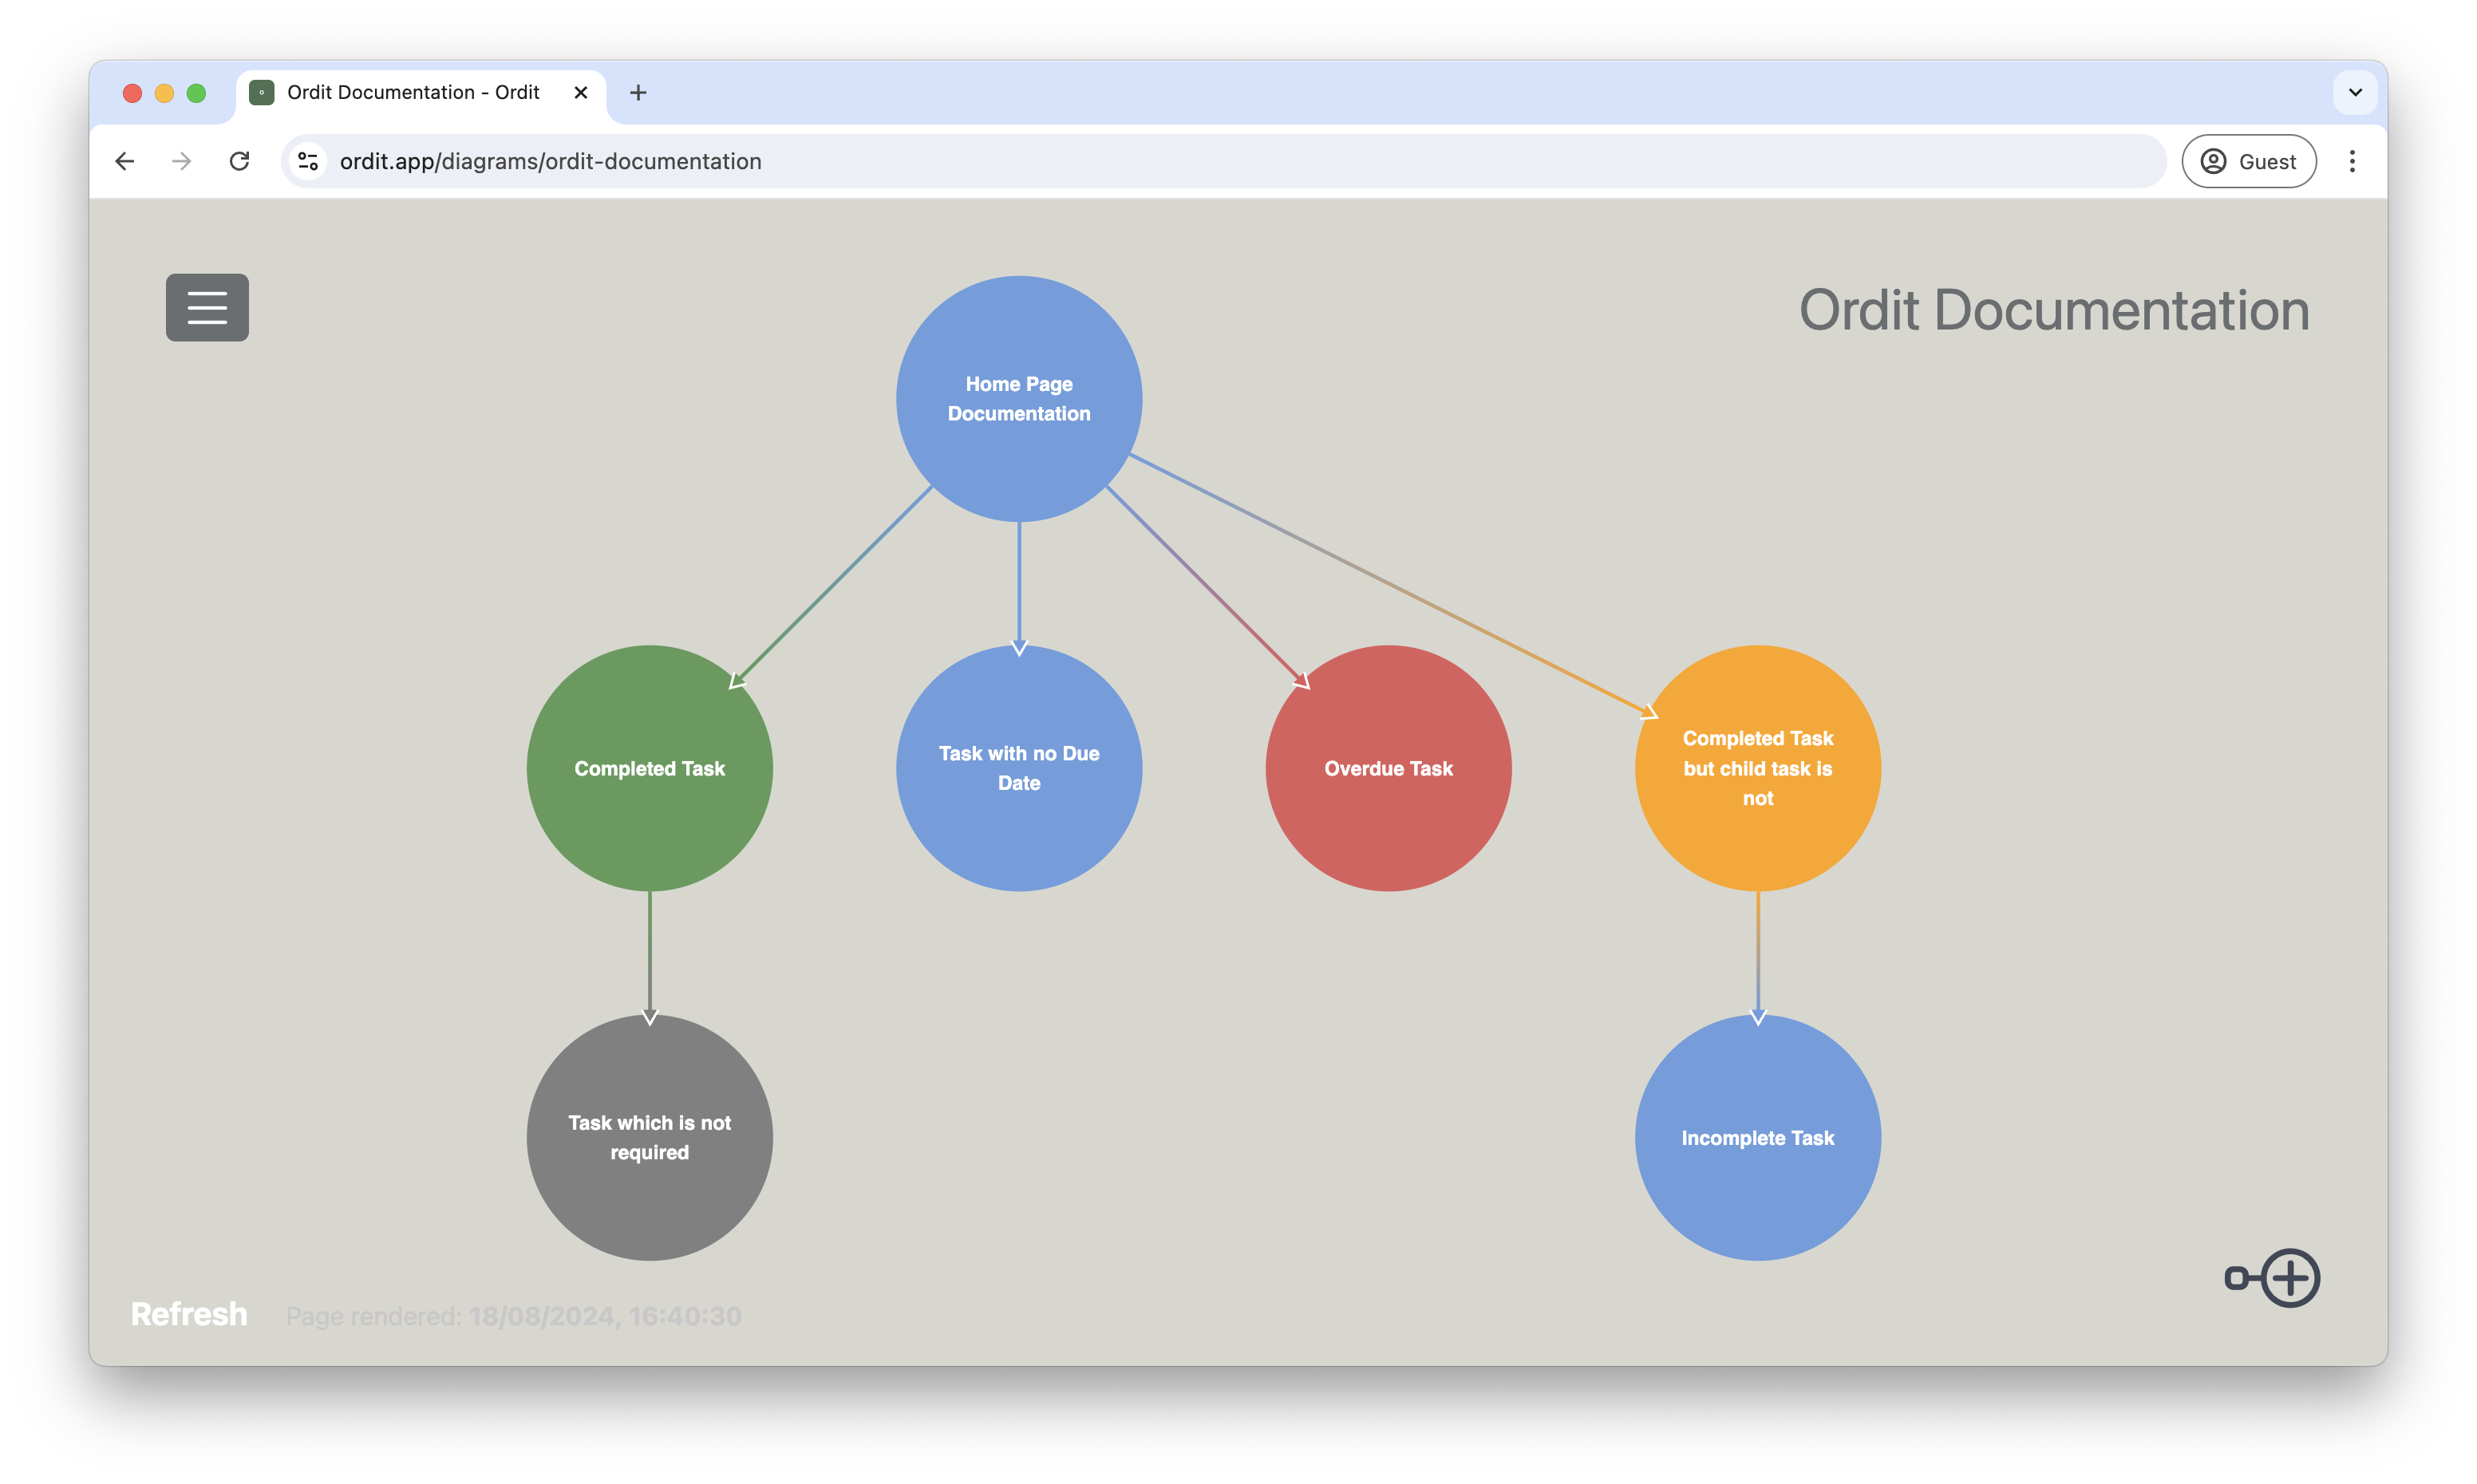 Caption: Example diagram with different states and colours
What do the dots and arrows on the page mean?
The dots in the screenshot above represent tasks or actions that need to be completed - nicknamed Nodes.
The lines represent the parent-child relationship between two nodes. If a node points to another, it means the node which is being pointed to is a predecessor to the task the arrow originates from. Having these relationships helps a user understand what is required for a task to be fully complete.
What do the colours mean?
| Colour | Definition |
|---|---|
| Green | The task has been completed and all child tasks have also been completed. |
| Orange | The task has been completed but not all child tasks have been completed. |
| Red | The due date has passed and the task has not been completed. |
| Grey | The task has been marked as optional. |
| Blue | The task is not complete and a due date does not exist or has not yet passed. |
In the future we aim to add more colour themes such that people with different colour preferences are accomodated and can experience Ordit to its fullest. We would love feedback on what colour combinations we can add.